Key Takeaways
Quick answer
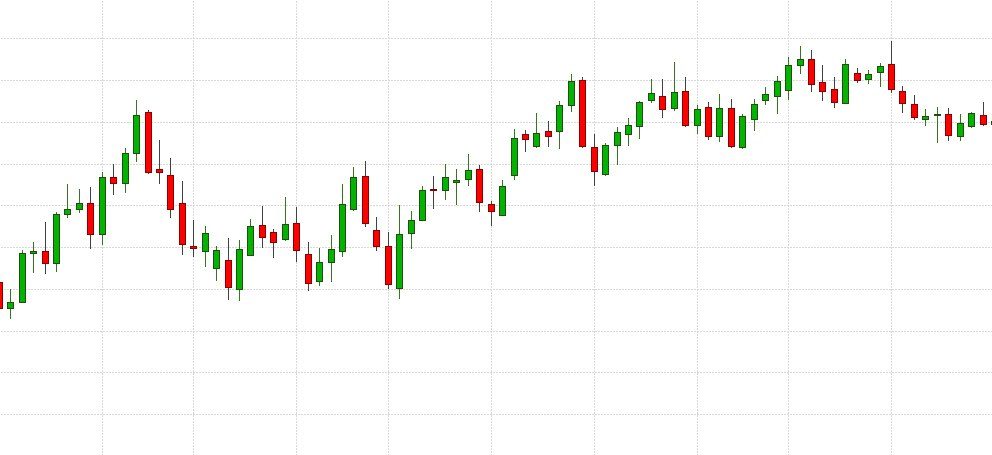
Each candle shows four prices for one time period: open, high, low and close (OHLC). The body spans the open and close; the thin wicks reach the high and low. Green usually means it closed higher than it opened, red lower. Candles record what happened — they do not predict prices.
- Each candle summarises one time period with four prices: open, high, low and close.
- The body runs from the open to the close; the thin wicks reach the highest and lowest prices.
- Green or red only tells you whether the close was above or below the open, and colours depend on your software settings.
- A candle does not show the order in which prices happened inside the period.
- Charts record past prices; US regulators warn that no trading system can guarantee profits.
What does a candlestick chart show?
A candlestick chart draws one “candle” for each time period you choose — one minute, one hour, one day. Every candle packs four prices into a single shape:
- Open — the first price of the period.
- High — the highest price traded.
- Low — the lowest price traded.
- Close — the last price of the period.
Together these are called OHLC. The descriptions on this page come from the education material of the derivatives exchange group CME Group — an exchange’s own teaching material, not a regulator. We found no regulator definition of a candlestick chart; the glossary of the US Commodity Futures Trading Commission (CFTC) does not include one.
What do the body and wicks of a candle mean?
CME Group’s course explains the two parts:
- Body: “The body of the candle, the thicker middle portion, shows the open and closing prices during the time frame.”
- Wicks (also called shadows): “The wick, illustrated by a thin line at the top and bottom of the body, shows the highest and lowest prices traded over the time frame.”
What do green and red candles mean?
Colour compares only two of the four prices: the open and the close. CME Group: “If the open is lower than the close, then the color of the bar will generally be green, depending on the color settings of your software. If the closing price is lower than the opening price, then the bar will generally be red, depending on the color settings of your software.”
Two things follow. First, colours are a display setting — some apps use other colours, or hollow and filled bodies. Second, a green candle does not mean “buy” and a red one does not mean “sell”. It only tells you whether the period ended above or below where it started.
How do you read a candle with real numbers?
Here are the two candles from the diagram, worked through (illustrative prices):
| Measure | Green candle | Red candle |
|---|---|---|
| Open → close | 100 → 104 | 104 → 98 |
| High / low | 108 / 95 | 106 / 97 |
| Body (close − open) | 104 − 100 = 4 | 98 − 104 = −6 |
| Upper wick | 108 − 104 = 4 | 106 − 104 = 2 |
| Lower wick | 100 − 95 = 5 | 98 − 97 = 1 |
| Full range (high − low) | 13 | 9 |
Reading the green candle in words: the price opened at 100, traded as high as 108 and as low as 95, and finished at 104. The upper wick is measured from the top of the body (the close, for a green candle); the lower wick from the bottom of the body (the open). For the red candle it is the other way round, because the open sits at the top of the body.
CME Group adds that “The longer the body, the more price moved over the time period of that candlestick” — which is just the arithmetic of the body row above.
What does a single candle hide?
A candle stores four numbers, so everything else about the period is lost. In particular, it does not show the order in which the high and low happened.
An illustrative example: four one-hour candles (open, high, low, close) of (100, 103, 99, 102), (102, 108, 101, 106), (106, 107, 95, 97) and (97, 105, 96, 104). Combined into one four-hour candle, the rules are: open = the first open (100), high = the highest high (108), low = the lowest low (95), close = the last close (104).
That is exactly the calm-looking green candle above — yet inside it, the price dropped from 106 to 95 in a single hour. Change the time frame and the same market can look completely different. That matters if you use stop orders: a stop can be triggered by a move that a longer candle hides inside its wick.
How is a candlestick chart different from a line or bar chart?
| Chart | What it shows per period |
|---|---|
| Line | Closing price only |
| Bar (OHLC) | Open, high, low, close |
| Candlestick | Open, high, low, close |
CME Group: “A line chart represents where price has been in the past and shows the closing price for a certain period of time.” And on bar charts: “Like a candlestick chart, a bar chart provides four pieces of data for each time period: the open, high, low and close.” A bar chart marks the open with a small tick to the left and the close with a tick to the right. Candles carry the same data, drawn as a box.
What does “close” mean on a crypto chart?
In traditional markets the close is an official moment. The CFTC glossary defines the closing price as “The price (or price range) recorded during trading that takes place in the final period of a trading session’s activity that is officially designated as the ‘close.’”
On a crypto chart, a candle’s “close” is simply the last price in the period your chart uses — the last trade of that hour or day on that platform. It is a feature of the chart, not an official closing price, so check how your app defines its candle periods. Each platform’s chart also reflects its own prices and spread.
Can candlestick patterns predict where prices go next?
A candle is a record of the past. The idea that it can forecast the future is an assumption of technical analysis, not an established fact. CME Group itself describes technicians as operating “on the assumption that past price movement can predict the future direction of prices”, and the CFTC’s glossary notes that technical analysis “can work consistently only if the theory that price movements are a random walk is incorrect.” Our guide to technical vs fundamental analysis explains both approaches.
US regulators are blunt about tools sold as prediction machines. The CFTC: “No trading system can guarantee profits”, and “AI technology can’t predict the future or sudden market changes.” The SEC: “past performance cannot predict how an investment strategy will perform in the future.”
What are the risks of trading from candlestick charts?
- Pattern sellers. Be wary of any course or signal group that claims a candle pattern wins most of the time. The CFTC warns that scammers selling AI trading bots claim “100 percent ‘win’ rates”, and urges you to ask whether a system’s advertised results are actual or hypothetical.
- Back-tests are not results. The SEC: “Remember that back-tested performance is hypothetical and does not reflect actual performance.”
- Short time frames, fast losses. The SEC’s Investor.gov says day trading “is extremely risky and can result in substantial financial losses in a very short period of time.”
- Crypto volatility. UK and EU regulators warn you could lose all the money you put into crypto. See crypto risks and our scam red flags.
Blockhorizon is an education site. Nothing here is a recommendation to buy, sell or hold any asset.
Frequently asked questions
What does OHLC stand for?
Open, high, low and close — the first, highest, lowest and last prices in one time period.
Does a long wick mean the price will reverse?
A long wick only shows that the price reached a high or low during the period and then moved away from it. No regulator source we found says it predicts the next move.
Which time frame should I use?
There is no correct one. Longer candles hide moves inside them; shorter candles show more detail. The time frame changes how a chart looks, not what the market did.
Why are my candles a different colour from someone else’s?
CME Group notes that candle colours depend on the colour settings of your software. Check your app’s settings before reading anything into colour.
Article Sources
9 sources
Blockhorizon checks every figure, date and quotation against primary sources: regulators, statistics bodies and original technical documents. Read our editorial policy.
- CME Group Education, Chart Types: candlestick, line, bar — cmegroup.com (accessed 2026-10-02)
- CME Group Education, Technical Analysis — cmegroup.com (accessed 2026-10-02)
- CFTC Glossary — C (Closing Price, Chartist) — cftc.gov (accessed 2026-10-02)
- CFTC Glossary — T (Technical Analysis) — cftc.gov (accessed 2026-10-02)
- CFTC, Fraud Advisory: Commodity Trading Systems Sold on the Internet — cftc.gov (accessed 2026-10-02)
- CFTC, Customer Advisory: AI Won’t Turn Trading Bots into Money Machines (Jan 2024) — cftc.gov (accessed 2026-10-02)
- SEC Investor.gov, Investor Bulletin: Performance Claims (Sep 2022) — investor.gov (accessed 2026-10-02)
- SEC Investor.gov, Day Trading — investor.gov (accessed 2026-10-02)
- UK Financial Conduct Authority, Crypto: the basics (updated Jan 2026) — fca.org.uk (accessed 2026-10-02)