Key Takeaways
Quick answer
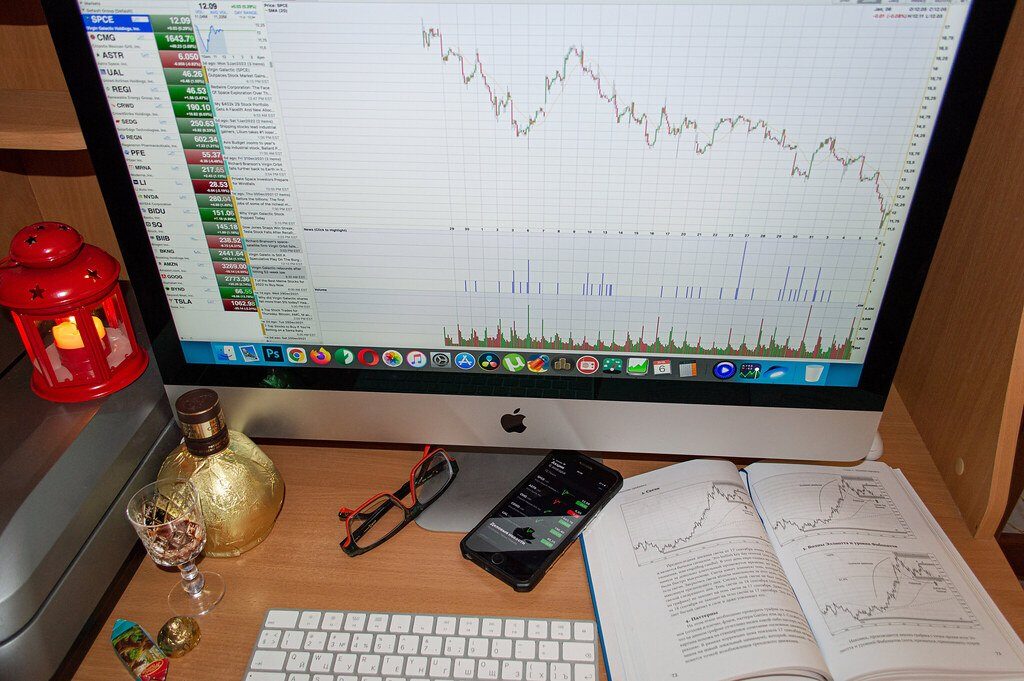
Technical analysis studies price charts — past prices, rates of change and trading volume. Fundamental analysis studies the underlying factors that drive supply and demand, such as a company’s business and accounts. Neither is a reliable way to predict prices, and US regulators warn that no trading system can guarantee profits.
- Technical analysis studies past prices, price changes and trading volume on charts.
- Fundamental analysis studies the underlying factors that affect supply and demand.
- The CFTC says technical analysis can work consistently only if price movements are not a random walk.
- The CFTC says there is no widely accepted standard for valuing a coin or token.
- US regulators warn that no trading system can guarantee profits and that hypothetical results are not real results.
What is technical analysis?
The US Commodity Futures Trading Commission (CFTC) defines technical analysis in its official glossary as “An approach to forecasting commodity prices that examines patterns of price change, rates of change, and changes in volume of trading and open interest, without regard to underlying fundamental market factors.”
In plain terms: a technical analyst looks only at what the market itself has done. The education course of the exchange group CME Group puts it this way: “A technical trader gets information directly from the market itself by looking at one picture—a price chart.” The CFTC calls a trader who works from charts a “chartist”: a “Technical trader who reacts to signals derived from graphs of price movements.”
If you have not read a price chart before, start with our guide to reading candlestick charts.
What is fundamental analysis?
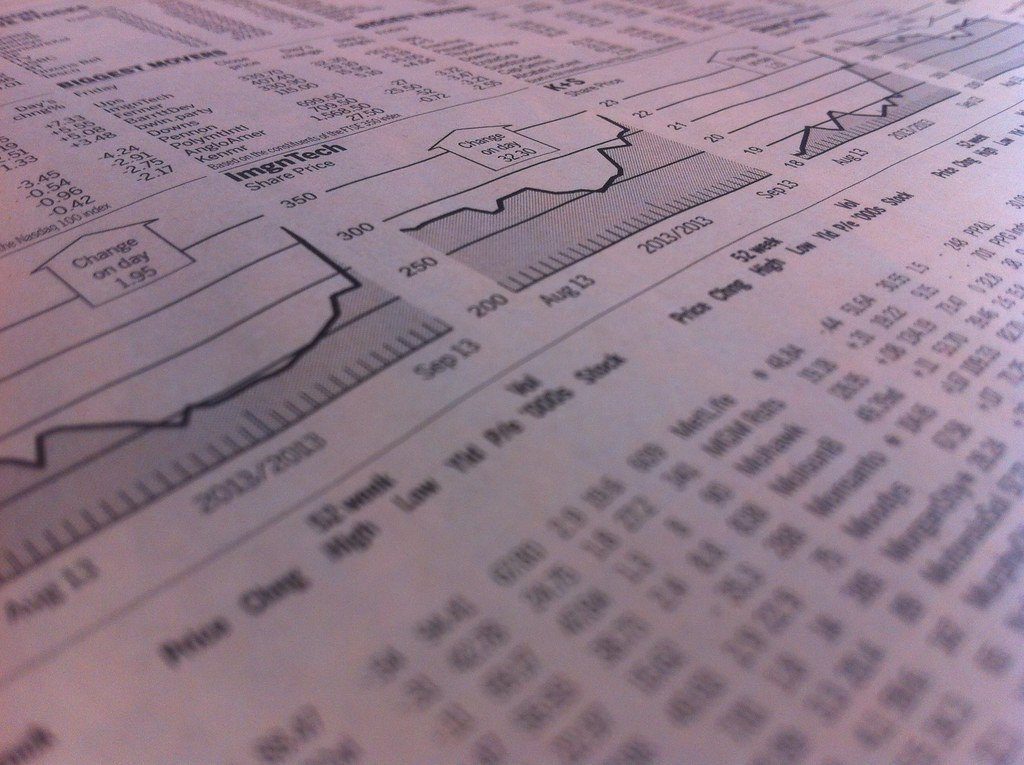
The CFTC’s glossary defines fundamental analysis as the “Study of basic, underlying factors that will affect the supply and demand of the commodity being traded in futures contracts.” CME Group contrasts the technical trader with a fundamental trader “who looks to news and myriad supply/demand data as trading inputs.”
For shares, the starting point is what the company itself reports. The SEC’s Investor.gov explains that a company’s annual report on Form 10-K is “Filed annually” and “offers a detailed picture of what the company does, and the risks it faces.” It includes:
- Business — the company’s main products and services.
- Risk Factors — significant risks the company faces.
- Management’s discussion and analysis (MD&A) — the company’s view of the past year’s results.
- Financial statements — audited figures, including the income statement, balance sheets and statement of cash flows.
How do technical and fundamental analysis compare?
| Technical | Fundamental | |
|---|---|---|
| Main question | What has the price been doing? | What drives supply and demand? |
| Main inputs | Price, rates of change, volume | News, accounts, supply and demand data |
| Typical document | A price chart | Company filings such as the 10-K |
| Built-in assumption | Past price moves contain information about future ones | Underlying factors eventually show up in prices |
The first three rows come from the CFTC and CME definitions above. The last row is our summary of what each approach takes for granted; neither assumption is guaranteed to hold.
What tools does technical analysis use?
The CFTC glossary defines several of the terms you will meet on any charting app:
- Trend: “The general direction, either upward or downward, in which prices have been moving.”
- Trendline: a line drawn across the bottom or top of a price chart. “If up, the trendline is called bullish; if down, it is called bearish.”
- Support: “a price area where new buying is likely to come in and stem any decline.”
- Momentum: “the relative change in price over a specific time interval.”
Many chart tools are simple arithmetic on past prices. An illustrative five-day average of closing prices of 100, 102, 101, 105 and 107 is (100 + 102 + 101 + 105 + 107) ÷ 5 = 515 ÷ 5 = 103. The calculation is exact; what it means for tomorrow’s price is not. Every line on a chart is built from prices that have already happened.
Does fundamental analysis work for crypto?
Only partly. Shares of US public companies come with SEC filings such as the 10-K. For coins and tokens, the CFTC is direct: “there is no widely-accepted standard for placing a value on a particular digital coin or token.”
The CFTC still suggests homework before buying — examining “the business plan, white paper or development plan” and checking the people and firms involved. Things you can check, without pretending they produce a fair price:
- The white paper. What the project says it does — for example, the original Bitcoin white paper.
- Supply. How many units exist, how many circulate, and how many are still locked. Our market cap guide explains circulating supply and fully diluted value.
- Who controls it. Who holds the keys, the treasury and the right to change the rules.
Can technical analysis predict prices?
Not reliably, judging by the official definitions. The CFTC’s definition of technical analysis carries a second sentence that is easy to miss: “Technical analysis can work consistently only if the theory that price movements are a random walk is incorrect.” Put the other way round: if prices do move like a random walk, chart patterns cannot be relied on to work consistently.
CME Group, which teaches charting, describes it as a working assumption: technicians “operate on the assumption that past price movement can predict the future direction of prices.” And the SEC’s bulletin on performance claims says: “past performance cannot predict how an investment strategy will perform in the future.”
Fundamental analysis has limits too. A thorough report tells you what a company or project is, not what the market will pay for it next week.
Why should you be careful with trading signals and courses?
Technical analysis is often sold as a shortcut — through signal groups, indicators, trading bots and paid courses. US regulators have warned about this kind of product repeatedly.
- The CFTC “urges you to be skeptical when promoters of trading systems and advisory services claim that their products and services will earn high profits with minimal risks”.
- It is blunt: “No trading system can guarantee profits”.
- On AI bots: “Scammers claim AI-created algorithms can generate huge returns—sometimes tens of thousands of percent—or yield 100 percent ‘win’ rates.” And: “AI technology can’t predict the future or sudden market changes.”
- FINRA, on tools that turn social media chatter into signals: information from them “may be inaccurate, incomplete or misleading.” Its advice: “Do not rely solely on social sentiment investing tools to make investment decisions.”
Before paying for any system, the CFTC suggests asking: are the advertised results actual or hypothetical? Will the seller give you independent verification? What is the total cost, including fees and subscriptions? What is the seller’s current and past disciplinary record? The SEC adds: “Remember that back-tested performance is hypothetical and does not reflect actual performance.”
Which approach should a beginner learn first?
Neither approach tells you what will happen, so think of them as ways to understand what you are looking at, not as ways to win. For a beginner, the basics usually matter more than either method:
- Know what you own and who controls it (the fundamental side).
- Be able to read a chart without believing it predicts anything (the technical side).
- Know your costs — trades usually carry fees and spreads, and frequent chart-based trading multiplies them.
- Decide in advance how much you could lose on one trade.
What are the risks of trading on analysis?
- False confidence. A clean chart or a detailed report can feel like certainty. The CFTC: “There is no such thing as a guaranteed investment or trading strategy.”
- Short-term trading. The SEC’s Investor.gov says day trading “is extremely risky and can result in substantial financial losses in a very short period of time.”
- Manipulated information. FINRA warns that social media posts “can have a hidden agenda” and can be used to spread false or misleading information to move prices.
- Crypto-specific risk. UK and EU regulators warn you could lose all the money you put into crypto. See crypto risks and the red flags of crypto scams.
Blockhorizon is an education site. Nothing here is a recommendation to buy, sell or hold any asset.
Frequently asked questions
Is technical analysis gambling?
We would not put it that way. It is a method of studying past prices. But the CFTC notes it can work consistently only if prices are not a random walk, and no trading system can guarantee profits.
Can I combine technical and fundamental analysis?
You can — one to understand what you own, the other to read price history. Combining them does not remove risk or make predictions reliable.
Is a signal group with a high win rate trustworthy?
Treat it with suspicion. The CFTC warns that scammers advertise “100 percent ‘win’ rates” and urges you to ask whether results are actual or hypothetical and independently verified.
Where do I find fundamental information about a US company?
In its SEC filings, such as the annual Form 10-K, which includes the business description, risk factors, management’s discussion and audited financial statements.
Article Sources
12 sources
Blockhorizon checks every figure, date and quotation against primary sources: regulators, statistics bodies and original technical documents. Read our editorial policy.
- CFTC Glossary — Technical Analysis, Trend, Trendline, Support, Momentum — cftc.gov (accessed 2026-10-02)
- CFTC Glossary — Fundamental Analysis — cftc.gov (accessed 2026-10-02)
- CFTC Glossary — Chartist — cftc.gov (accessed 2026-10-02)
- CME Group Education, Technical Analysis — cmegroup.com (accessed 2026-10-02)
- SEC Investor.gov, How to Read a 10-K — investor.gov (accessed 2026-10-02)
- CFTC, Customer Advisory: Use Caution When Buying Digital Coins or Tokens — cftc.gov (accessed 2026-10-02)
- CFTC, Fraud Advisory: Commodity Trading Systems Sold on the Internet — cftc.gov (accessed 2026-10-02)
- CFTC, Customer Advisory: AI Won’t Turn Trading Bots into Money Machines (Jan 2024) — cftc.gov (accessed 2026-10-02)
- FINRA, Social Sentiment Investing Tools — Think Twice Before Trading Based on Social Media (Apr 2019) — finra.org (accessed 2026-10-02)
- SEC Investor.gov, Investor Bulletin: Performance Claims (Sep 2022) — investor.gov (accessed 2026-10-02)
- SEC Investor.gov, Day Trading — investor.gov (accessed 2026-10-02)
- UK Financial Conduct Authority, Crypto: the basics (updated Jan 2026) — fca.org.uk (accessed 2026-10-02)